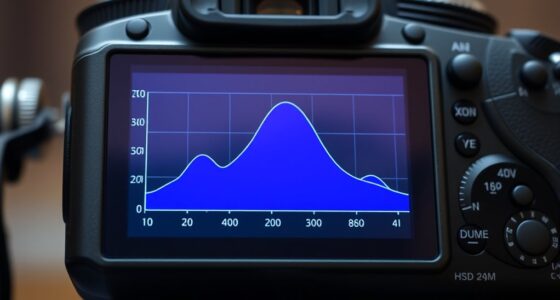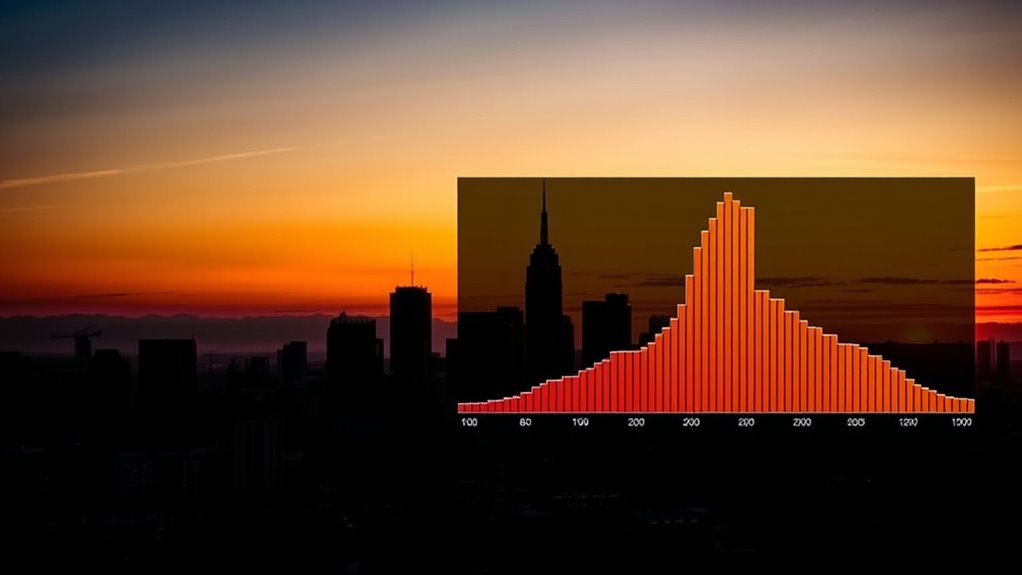

To evaluate exposure and dynamic range using a histogram, look at its shape and distribution. A balanced histogram with data spread across shadows, midtones, and highlights indicates good exposure with plenty of tonal detail. A skewed histogram toward the right shows potential overexposure, risking blown highlights, while one skewed to the left suggests underexposure, losing shadow detail. Recognizing these signs helps you make smarter adjustments—so, keep exploring to master this essential tool.
Key Takeaways
- Histograms visually represent tonal value distribution, aiding quick assessment of exposure and dynamic range.
- A balanced histogram with data spread across all tones indicates optimal exposure and high dynamic range.
- Right-skewed histograms suggest overexposure, risking highlight clipping; left skew indicates underexposure with shadow loss.
- Recognizing histogram patterns helps adjust camera settings to match scene contrast and sensor capabilities.
- Understanding lighting ratios and sensor limits improves interpretation of histogram data for precise exposure control.
Have you ever wondered how to quickly understand the distribution of data? When it comes to photography and digital imaging, the answer lies in mastering histograms. A histogram is a visual tool that shows you how tonal values are distributed across your image, helping you evaluate exposure and dynamic range with ease. By analyzing the histogram, you can determine if your photo is properly exposed or if adjustments are needed. It’s especially useful because it provides instant feedback without relying solely on your camera’s screen, which can sometimes be misleading in bright or dim lighting conditions. Recognizing histogram patterns can also help you develop a more intuitive understanding of exposure control. Understanding lighting ratios is essential when interpreting histograms. Lighting ratios describe the difference between the brightest and darkest areas within a scene. A high contrast scene, with a big lighting ratio, will produce a histogram with data spread across the entire tonal spectrum — from deep blacks on one side to bright whites on the other. Conversely, a low contrast scene will have a more narrow distribution, concentrated around midtones. Recognizing these patterns helps you decide whether to adjust your exposure settings, such as shutter speed, aperture, or ISO, to better capture the scene’s dynamic range. Your camera sensors play a significant role in how this data is represented. Different sensors have varying capabilities when it comes to capturing the full tonal range. For instance, a full-frame sensor generally handles highlights and shadows better than smaller sensors, providing a broader dynamic range. When you review your histogram, keep in mind that these hardware differences influence how much detail you can retain in the brightest and darkest areas. Knowing your camera sensor’s limits allows you to interpret histograms more accurately and make smarter exposure decisions. To make effective use of histograms, look for signs of overexposure or underexposure. If your histogram is heavily skewed to the right, you risk losing highlight details—a condition called clipping, which results in blown-out whites. Conversely, if it’s skewed to the left, shadow details might be crushed into solid black, losing subtle gradations. Ideally, you want a histogram that’s well-balanced, with data spread across the entire range without touching either end. This balance indicates a good exposure with potential for high dynamic range, especially if your scene contains both bright and dark areas. In essence, mastering histograms empowers you to evaluate exposure quickly and accurately. By understanding lighting ratios and the capabilities of your camera sensor, you can interpret the distribution of data more effectively. This knowledge helps you make informed adjustments, ensuring your images capture the full spectrum of tonal detail and accurately reflect the scene you’re photographing. It’s a fundamental skill that elevates your photographic control and results.

SWIFT EP2M 2-MP 1920 * 1080 Digital Eyepiece Microscope Camera, fits 23.2 mm eyepieces & Most trinocular phototubes, S-Viewer for Measuring & Annotation, Compatible with Windows 7–11 & macOS
「2 MP 1920*1080/30 fps live view」 stable, hands-free image on PC/projector (progressive scan). Ideal for teaching, lab reviews…
As an affiliate, we earn on qualifying purchases.
As an affiliate, we earn on qualifying purchases.
Frequently Asked Questions
How Do Histograms Differ Between RAW and JPEG Images?
When comparing histograms of raw and JPEG images, raw histograms often show broader exposure ranges because raw files retain more data. You can perform raw processing and histogram adjustments more freely without losing detail. JPEG histograms are more compressed due to compression and in-camera processing, limiting adjustments. Understanding these differences helps you better evaluate exposure and dynamic range, especially in raw images where you have greater control.
What Are Common Mistakes When Interpreting Histograms?
You might fall for histogram misconceptions, like assuming a histogram always indicates perfect exposure or that a balanced histogram means a good image. Common misinterpretations include mistaking high shadows for underexposure or ignoring clipping on the highlights. Be cautious, as histograms don’t tell the full story of image quality. Instead, use them as guides alongside your visual assessment, avoiding these simple mistakes for better exposure control.
How Can I Use Histograms to Improve Low-Light Photography?
To improve low-light photography with histograms, focus on adjusting your lighting to avoid underexposure, which causes shadows to clip on the left. Use the histogram to confirm the peaks aren’t pushed too far right, preventing overexposure. Make lighting adjustments accordingly, and consider noise reduction in post-processing to enhance image quality. Regularly checking the histogram guides you in balancing exposure, reducing noise, and capturing clearer, well-exposed low-light shots.
What Histogram Settings Are Best for High-Contrast Scenes?
For high-contrast scenes, set your histogram to highlight contrast by ensuring the graph touches both ends without clipping. Adjust exposure to avoid losing detail in shadows or highlights, keeping the histogram’s peaks away from the edges. Use your camera’s highlight warning or ETTR (Expose To the Right) technique to maximize dynamic range. This helps you achieve balanced exposure while capturing rich detail across the entire tonal range.
How Do Histograms Relate to Color Accuracy in Images?
Think of your histogram as a map guiding your color journey. It shows how well your image’s colors are balanced, helping you assess color calibration and profiles. When the histogram is properly balanced, your colors are more accurate and true to life. By monitoring it, you ensure your camera’s settings align with your display’s color profile, resulting in vibrant, consistent images. Without this, color accuracy can drift like a ship off course.
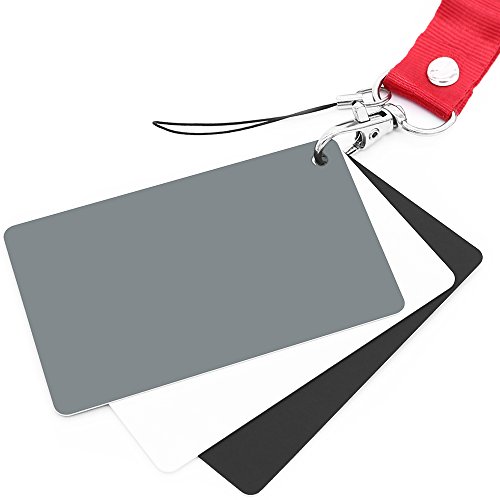
Anwenk Grey White Balance Card 18% Exposure Photography Custom Calibration Camera Checker for DSLR and Film
Neutral 18% Grey / Gray Card with matte finish for scratch resistant. Non reflective and waterproof.
As an affiliate, we earn on qualifying purchases.
As an affiliate, we earn on qualifying purchases.
Conclusion
Mastering histograms transforms your photos from mere snapshots into breathtaking works of art. With a keen eye on exposure and dynamic range, you’ll wield this tool like a magic wand, banishing blown-out highlights and crushing shadows into oblivion. Suddenly, every shot you take becomes a masterpiece, bursting with vibrant detail and perfect balance. Embrace histogram basics, and watch your images leap off the screen with an intensity so fierce, they’ll leave viewers utterly spellbound.
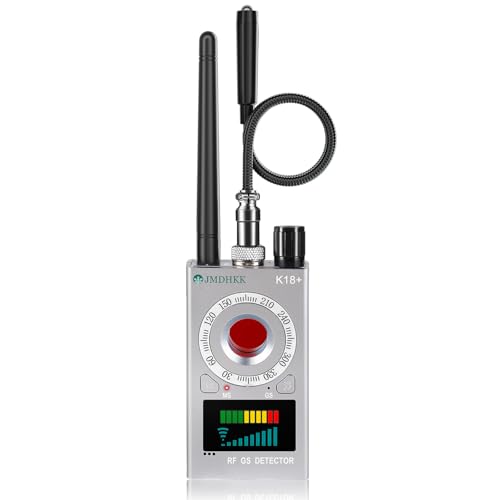
JMDHKK Hidden Camera Detector, Spy Camera Finder, Bug Detector, Magnetic Field Sensor, Listening Device Detector – Privacy Protection Tool for Home, Office, Hotel, and Travel Security(Silver)
Hidden Camera Detection: This device ensures your privacy by effectively identifying hidden cameras in hotels, bathrooms, and other…
As an affiliate, we earn on qualifying purchases.
As an affiliate, we earn on qualifying purchases.
photo editing histogram analyzer
As an affiliate, we earn on qualifying purchases.
As an affiliate, we earn on qualifying purchases.