
TL;DR

Prime made for students and young adults
- Fast, free delivery for dorm and study essentials
- Prime Video and Amazon Music included
- Member-only deals
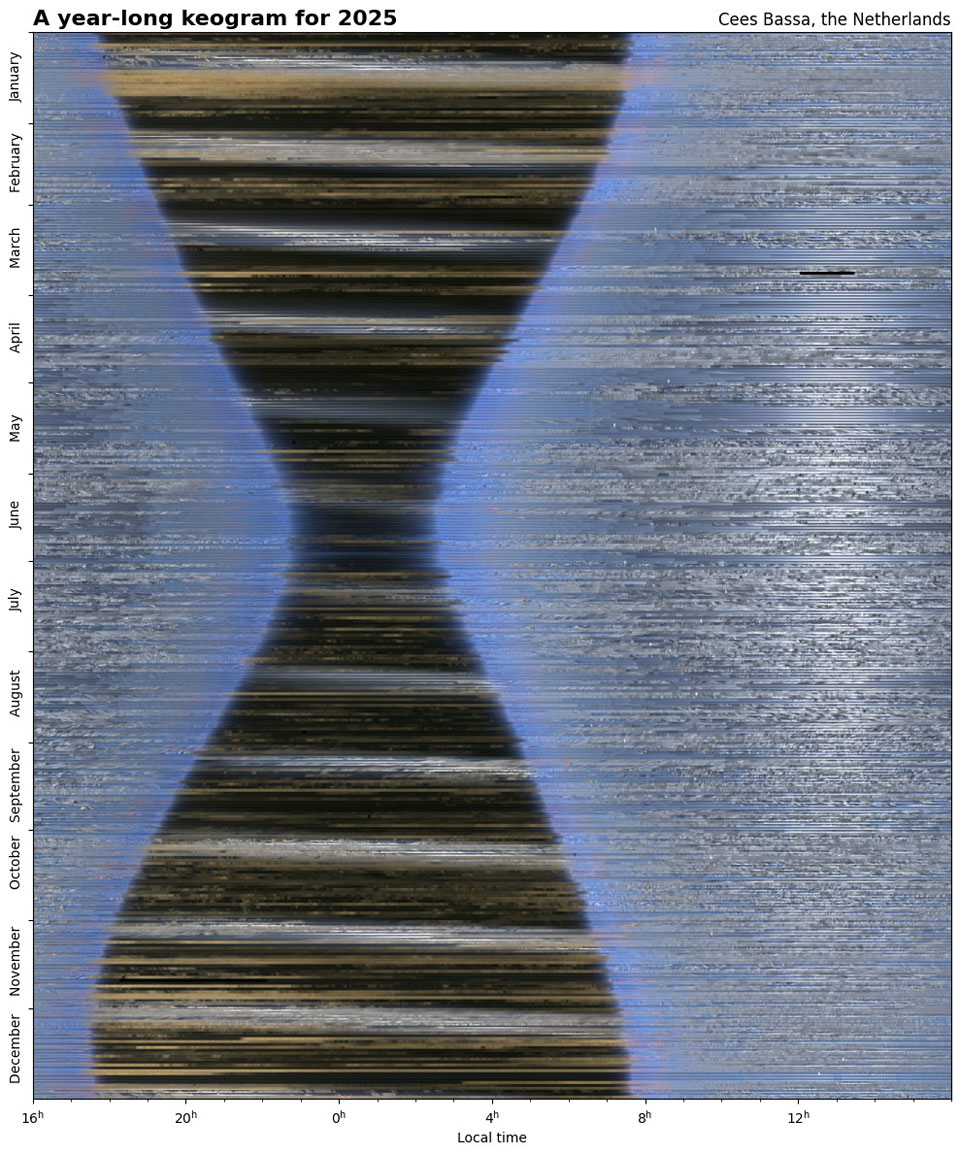
A keogram compiles a year’s worth of sky images into a single, mesmerizing strip, showing auroras, moon glow, and seasonal shifts. NASA’s 2025 keogram highlights how space weather shapes what we see overhead.
Imagine seeing the entire sky’s story played out in a single, sweeping visual. That’s exactly what NASA’s recent keogram achieves—condensing a year’s worth of sky observations into one striking image. It’s a visual diary of Earth’s atmospheric shifts, moon glow, and auroras, all stitched together from thousands of images captured every 15 seconds over the Netherlands.
This isn’t just pretty pictures—these visuals reveal the hidden rhythm of our planet’s upper atmosphere. If you’ve ever wondered how solar storms influence the flickering curtains of auroras or how seasons shape the night sky, this article will take you through the fascinating story told by the 2025 keogram.
Key Takeaways
- Keograms are visual summaries of atmospheric changes over a year, revealing seasonal shifts and auroras in a single image.
- The 2025 keogram shows how Earth’s tilt causes the black hourglass shape to expand and contract, reflecting seasonal darkness.
- Moon glow creates predictable bright bands crossing the keogram, acting as a lunar calendar for the night sky.
- Advances in imaging tech and AI now make keogram data more detailed, real-time, and useful for space weather forecasting.
- Creating your own keogram is accessible with a wide-angle camera, tripod, and free software—turning sky-watching into a seasonal journey.
wide-angle astrophotography camera
As an affiliate, we earn on qualifying purchases.
As an affiliate, we earn on qualifying purchases.
What exactly is a keogram—and why does it matter?
A keogram is a long, narrow strip of images showing how the sky changes along a fixed line of sight over time. Think of it as a time-lapse, but stretched vertically. NASA’s 2025 keogram was created from images taken every 15 seconds, revealing everything from moon glow to fleeting auroras.
These visuals help scientists see patterns—like the thickening of the black hourglass shape during winter or the thinning during summer solstice. For example, during the longest nights of winter, the black shape widens, illustrating how much darkness dominates the sky. Conversely, the summer solstice narrows this shape, reflecting longer days and shorter nights.
As an affiliate, we earn on qualifying purchases.
How does the 2025 keogram show Earth’s seasonal dance?
The 2025 keogram acts like a seasonal calendar drawn in the sky. The top shows January, with short, dark nights and a narrow black hourglass. Moving downward, the shape widens, peaking around December when nights are longest. During the summer, the black shape shrinks, highlighting how daylight stretches longer.
For example, on the winter solstice, the black shape is thickest, symbolizing the deep, dark nights. In contrast, during the summer solstice, it’s at its thinnest—a vivid, visual confirmation of Earth’s tilt and seasonal rhythm, captured in a single image.
As an affiliate, we earn on qualifying purchases.
What do the bright bands crossing the night sky tell us?
The twelve light bands crossing the night part of the keogram are caused by the glow of the Moon as it arcs across the sky each month. These bands serve as a lunar calendar, marking the phases and position of the Moon throughout 2025.
Imagine the bright, silver streaks moving steadily, like a celestial train passing overhead. They punctuate the dark background, reminding us how lunar cycles influence night sky brightness and atmospheric phenomena. For example, the full moon’s bright band during the summer months makes the night less dark, affecting nocturnal wildlife and human activities.
As an affiliate, we earn on qualifying purchases.
Why does space weather turn the sky into a flickering canvas?
Space weather—solar storms and geomagnetic activity—injects energy into Earth’s atmosphere, igniting auroras that dance across the sky. The keogram from 2025 captured these shimmering curtains during periods of heightened solar activity. Bright green, purple, and red hues ripple along the black backdrop, a vivid display of solar particles colliding with atmospheric gases.
For example, during a geomagnetic storm in 2025, the keogram showed extraordinary auroral displays, stretching from horizon to horizon, sparking colors that looked like fire flickering in the night. It’s like witnessing a cosmic light show orchestrated by the Sun’s volatile temperament.
What recent tech advances made the 2025 keogram possible?
In recent years, all-sky cameras have become sharper, more sensitive, and capable of capturing faint atmospheric details. The 2025 keogram benefits from high-resolution sensors and faster data processing, allowing continuous monitoring without gaps.
AI and machine learning algorithms now analyze the massive flows of images, instantly detecting significant events like auroras or unusual atmospheric glow. For example, these tools can flag a sudden surge in auroral activity, helping scientists respond faster and better understand space weather patterns.
Can keograms predict future space weather? Here’s what science says
Keograms provide a visual record of atmospheric reactions to solar activity, but they aren’t predictive tools on their own. However, when combined with solar data and models, they help improve space weather forecasts. For instance, a spike in auroral activity seen in a keogram could signal incoming geomagnetic storms if correlated with solar flare data.
Scientists are working on integrating keogram data into real-time prediction systems, but it’s still an evolving science. Think of keograms as the atmospheric diary that adds context to solar forecasts, rather than a crystal ball.
How to get your own view of the sky’s story
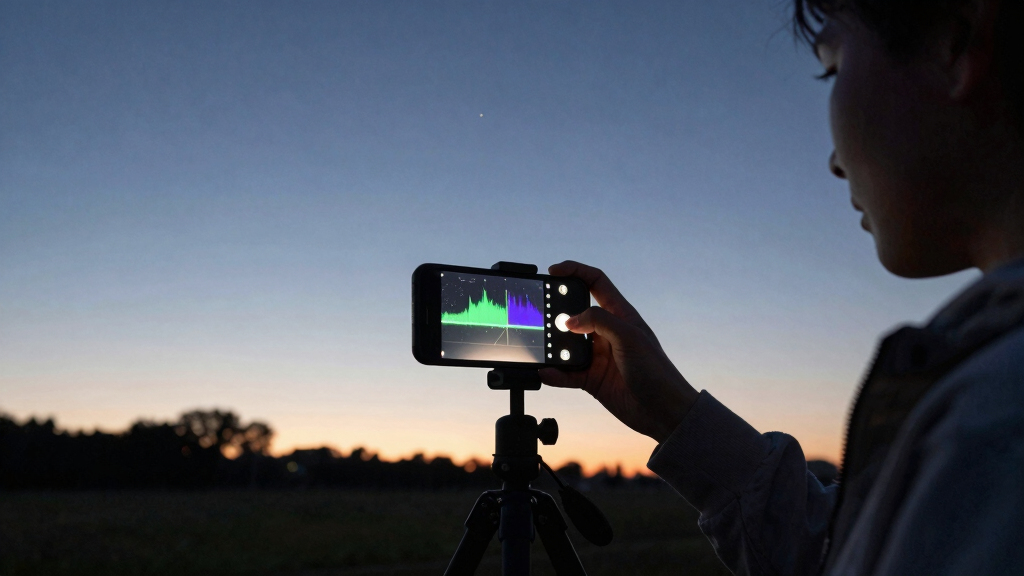
- Find a wide, unobstructed view of the sky—away from city lights. A wide-field lens or a smartphone with an app can do the trick.
- Use a camera capable of long exposures and continuous shooting. Mount it on a sturdy tripod.
- Record for several hours during different seasons, and then compile the images into a keogram using free software or online tools.
- Look for patterns—like the changing width of the black shape or streaks from moonlight and auroras.
What’s next for sky watchers and scientists?
As technology advances, expect keogram analysis to become more detailed and accessible. The coming years will see even more precise monitoring, potentially predictive models, and broader public engagement. Imagine apps or websites where you can see real-time keograms from around the world, showing Earth’s atmospheric pulse in vivid detail.
For sky enthusiasts, this means deeper appreciation and understanding. For scientists, it’s a stepping stone toward better forecasting and mitigation of space weather’s impacts—keeping satellites, power grids, and even airline routes safer.
Frequently Asked Questions
What exactly is a keogram, and how is it made?
A keogram is a narrow strip of images showing how the sky changes along a fixed line of sight over time. It’s made by stitching together images taken every few seconds—often with all-sky cameras—to reveal patterns like auroras, moon glow, and seasonal shifts.
Why are keograms important for understanding Earth’s atmosphere and space weather?
Keograms visually record how atmospheric phenomena respond to solar activity, helping scientists track auroras, airglow, and geomagnetic storms. They’re essential for understanding how space weather impacts Earth’s upper atmosphere and technological systems.
What did the keogram of 2025 reveal about solar activity or auroras?
The 2025 keogram captured intense auroral displays during solar storms, with shimmering green and purple curtains. It also showed how increased solar activity during peak solar cycle periods can cause more frequent, vivid auroras across higher latitudes.
How does space weather affect us here on Earth?
Space weather can disrupt satellites, communication, and power grids. For example, geomagnetic storms can induce currents that damage electrical infrastructure or interfere with GPS signals—making understanding space weather vital for modern life.
Can keograms predict future space weather events?
While keograms themselves don’t predict storms, they provide real-time visual evidence of atmospheric reactions. When combined with solar data, they help improve forecasts—offering a clearer picture of when and where space weather might impact Earth.
Conclusion
The sky’s story in 2025, captured by a keogram, offers a vivid reminder: Earth’s atmosphere is a dynamic, living canvas shaped by seasons, moonlight, and solar storms. These visuals turn complex space weather into something tangible and beautiful—an atmospheric diary you can almost read like a map.
Next time you look up, think of the hidden dance happening above—a dance we’re only beginning to understand, thanks to tools like keograms. Your next step? Start observing, capturing, and appreciating the sky’s ever-changing story.
Fall Picks
fall essentials
As an affiliate, we earn on qualifying purchases.