To effectively adjust image histograms, you need to understand key calculations like identifying the minimum and maximum pixel intensities, determining bin ranges and frequencies, and computing the cumulative distribution function (CDF). These steps help you analyze pixel distribution, perform histogram stretching, and apply equalization for better contrast. Correct calculations guarantee accurate adjustments and preserve image quality. Keep exploring these foundational concepts to master image enhancement techniques even further.
Key Takeaways
- Determine minimum and maximum pixel intensities to define histogram bounds for stretching.
- Calculate bin width by dividing data range by the number of histogram bins.
- Compute the cumulative distribution function (CDF) to map pixel values for contrast enhancement.
- Normalize pixel values by subtracting min and dividing by the data range for consistency.
- Address outliers and edge cases to ensure accurate histogram analysis and effective stretching.
Top picks for "histogram stretch glossary"
Open Amazon search results for this keyword.
As an affiliate, we earn on qualifying purchases.
Understanding Image Histograms
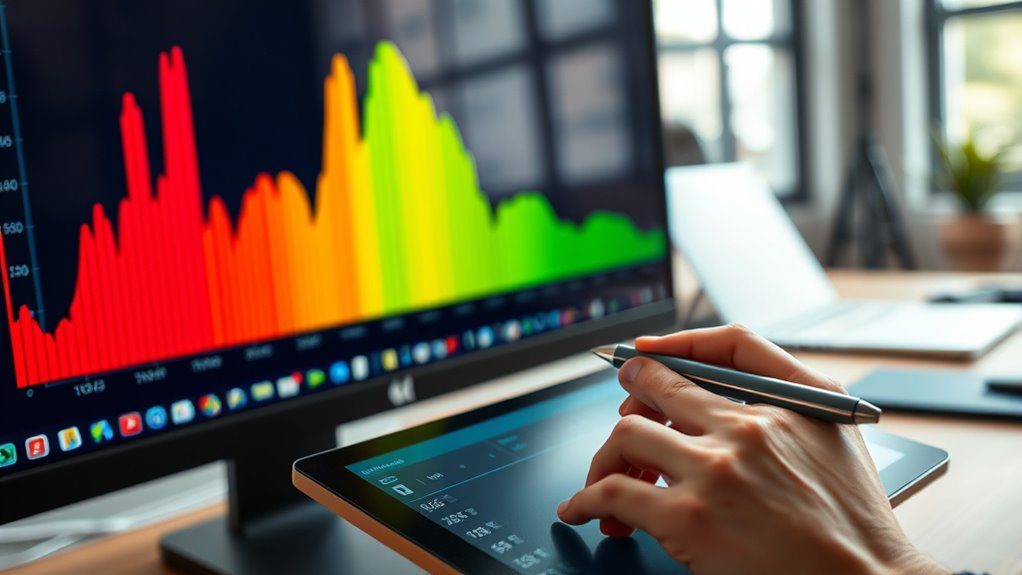
Understanding image histograms is essential because they visually represent the distribution of pixel brightness levels within an image. This insight helps you identify areas that need enhancement. By manipulating color channels, you can adjust individual histograms to improve overall tone and color balance. Histogram contrast adjustment involves stretching or compressing these distributions to make details more visible, especially in shadows or highlights. When you work with histograms, you’re fundamentally controlling how pixel brightness values are distributed across the image. This process allows for precise enhancements, ensuring your image’s contrast and color are optimized. Grasping how histograms reflect pixel brightness and color channel data empowers you to make targeted adjustments that improve image quality efficiently. Additionally, understanding AI discoveries influences how modern image editing techniques evolve, offering new tools and methods for photo enhancement.
Calculating Histogram Bins and Frequencies

To calculate histogram bins and frequencies, you need to determine the appropriate bin ranges for your data. Then, you count how many pixels fall into each bin to understand the distribution. Be mindful of edge cases, like pixels on bin boundaries, to guarantee accurate calculations. Additionally, understanding color accuracy helps optimize the visual results of your histogram.
Determining Bin Ranges
Determining bin ranges is a crucial step in creating an effective histogram, as it directly influences how data is grouped and visualized. Your first task is bin range selection, which depends on your data’s spread and the number of bins you want. To do this accurately, start with bin width calculation—subtract the minimum value from the maximum value and divide by the number of bins. This yields the size of each bin. Once you have the bin width, set your bin ranges accordingly, ensuring they cover the entire data set without gaps or overlaps. Proper bin range determination helps reveal meaningful patterns and prevents misleading representations, making your histogram a reliable tool for analysis. Additionally, understanding concepts like sound healing science can deepen your appreciation for how frequencies influence data perception and interpretation.
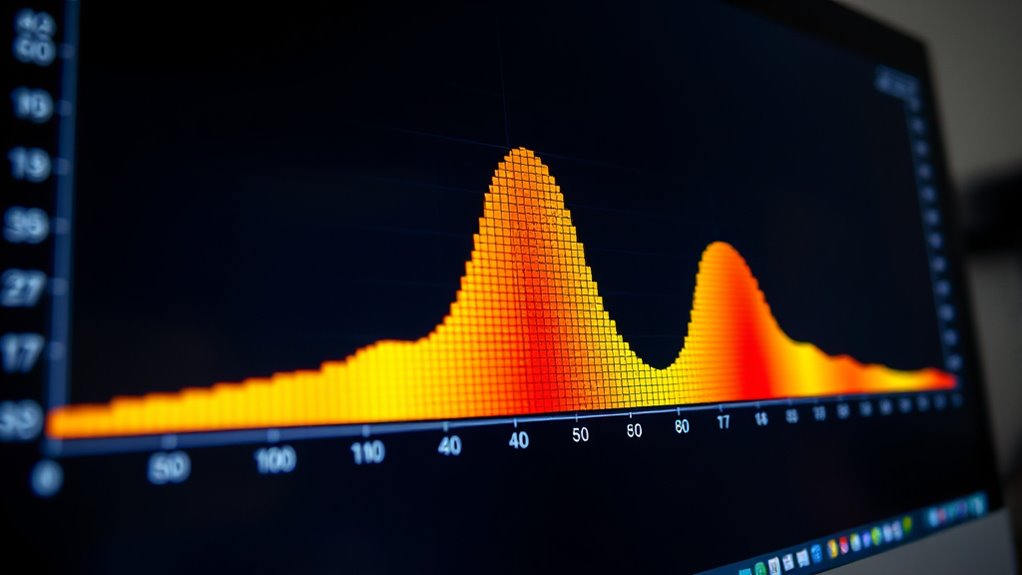
Counting Pixel Frequencies
Counting pixel frequencies involves tallying how many pixels fall into each bin range of your histogram. You do this by examining the pixel intensity values across your image, assigning each pixel to its corresponding bin based on its intensity. This process creates a clear picture of the frequency distribution, showing how often each intensity level occurs. By counting these pixel frequencies, you can identify the most common intensity ranges and understand the overall brightness and contrast. This step is essential for accurate histogram analysis, as it translates raw pixel data into a visual and numerical summary. Once completed, these counts serve as the foundation for further adjustments, like stretching or equalization, to improve your image’s visual quality. Understanding how pixel intensity levels are distributed helps in making precise enhancements to image contrast and brightness.
Handling Edge Cases
Handling edge cases when calculating histogram bins and frequencies is crucial to guarantee accurate analysis. Proper edge case handling ensures that outliers don’t distort your histogram or skew your results. When dealing with outlier management, you need to account for data points that fall outside expected ranges or are exceptionally high or low. This might involve clamping values to the nearest bin boundary or creating separate bins for outliers. Failing to address these edge cases can lead to misleading representations of your data’s distribution. Always check for outliers before binning, and decide whether to include, exclude, or specially handle them. Additionally, understanding data privacy challenges can help in managing sensitive information within your datasets. By proactively managing edge cases, you keep your histogram precise and your insights reliable.
Determining the Minimum and Maximum Intensity Values
To effectively enhance the contrast of an image through histogram stretching, you first need to identify its minimum and maximum intensity values. These values define the intensity range, which determines how much you can expand the pixel values to improve contrast. You scan the histogram to find the lowest pixel value with non-zero frequency, representing the minimum intensity, and the highest pixel value with non-zero frequency, representing the maximum intensity. Knowing these extremes helps you set the bounds for stretching. By adjusting the pixel values within this range, you stretch the histogram to span the full displayable intensity spectrum. This process guarantees your image’s darkest and brightest areas are properly emphasized, improving overall visual clarity. Understanding the importance of image enhancement techniques ensures that you apply the right adjustments for optimal results.
Computing the Cumulative Distribution Function (CDF)
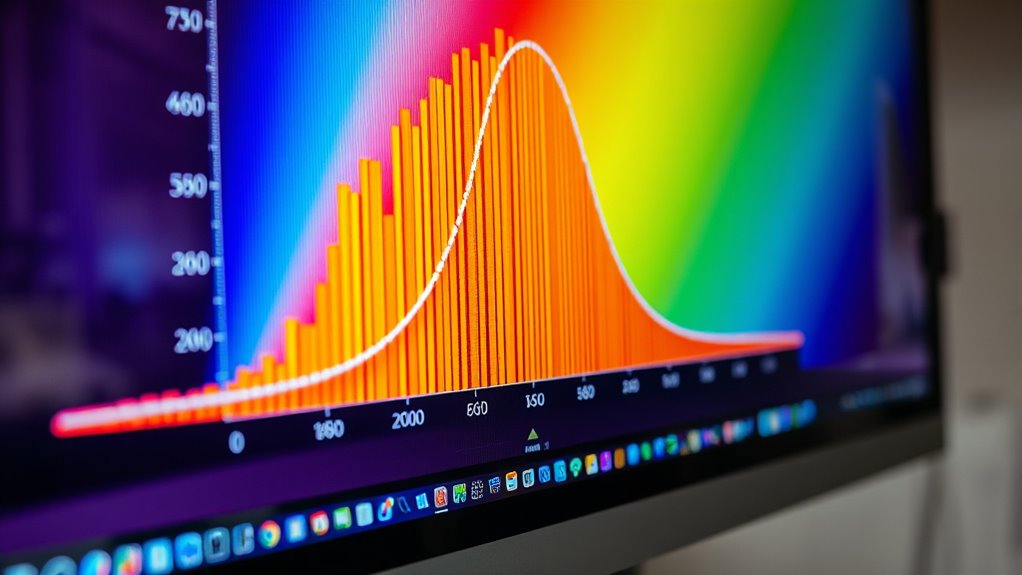
Have you ever wondered how to transform a histogram into a form that highlights the distribution of pixel intensities? Computing the CDF (Cumulative Distribution Function) helps with contrast enhancement by accumulating pixel frequencies, which redistributes the dynamic range. This transformation makes subtle details more visible. To visualize, consider how the CDF maps each pixel value to its cumulative probability:
| Pixel Intensity | Cumulative Probability |
|---|---|
| Low (dark) | 0.1 |
| Mid | 0.5 |
| High (bright) | 0.9 |
| Maximum | 1.0 |
The CDF effectively equalizes the histogram, stretching the dynamic range and improving overall contrast. This step is essential before applying histogram stretching for clearer, more detailed images. Additionally, understanding how the Cumulative Distribution Function interacts with image processing techniques is crucial for achieving optimal results.
Applying Histogram Equalization Formula
Now that you’ve calculated the cumulative distribution, you can use it to apply the equalization formula. This step adjusts pixel intensities to enhance the image contrast effectively. By following the formula, you’ll redistribute pixel values for a more balanced histogram. Understanding juice detox can also inform your approach to image enhancement techniques.
Calculating Cumulative Distribution
Calculating the cumulative distribution function (CDF) is a essential step in applying histogram equalization. It helps you understand how pixel intensities are distributed across the image, which is fundamental for contrast enhancement. To do this, you sum the normalized histogram values up to each intensity level, creating a cumulative curve. This curve indicates the cumulative frequency of pixel intensities, allowing you to map original pixel values to new ones. By using the CDF, you effectively stretch the dynamic range of your image, making details more visible in darker or brighter areas. This process guarantees that the contrast is more balanced, leading to a more visually appealing and informative image. Accurate calculation of the CDF is imperative for achieving best results in histogram equalization. Additionally, understanding newborn sleep patterns can help caregivers create optimal environments for rest and development.
Applying Equalization Formula
Are you ready to apply the histogram equalization formula to enhance your image’s contrast? This step involves using the equalization techniques to redistribute pixel intensities, making dark areas brighter and bright areas darker. To do this, you’ll modify the histogram based on the cumulative distribution function. Here’s a simple example:
| Original Intensity | Cumulative Distribution | Equalized Intensity |
|---|---|---|
| 50 | 0.2 | 51 |
| 100 | 0.5 | 101 |
| 200 | 0.8 | 204 |
These histogram modifications help improve image detail and contrast through precise calculations. Applying the equalization formula guarantees your image benefits from effective contrast stretching, making every detail pop.
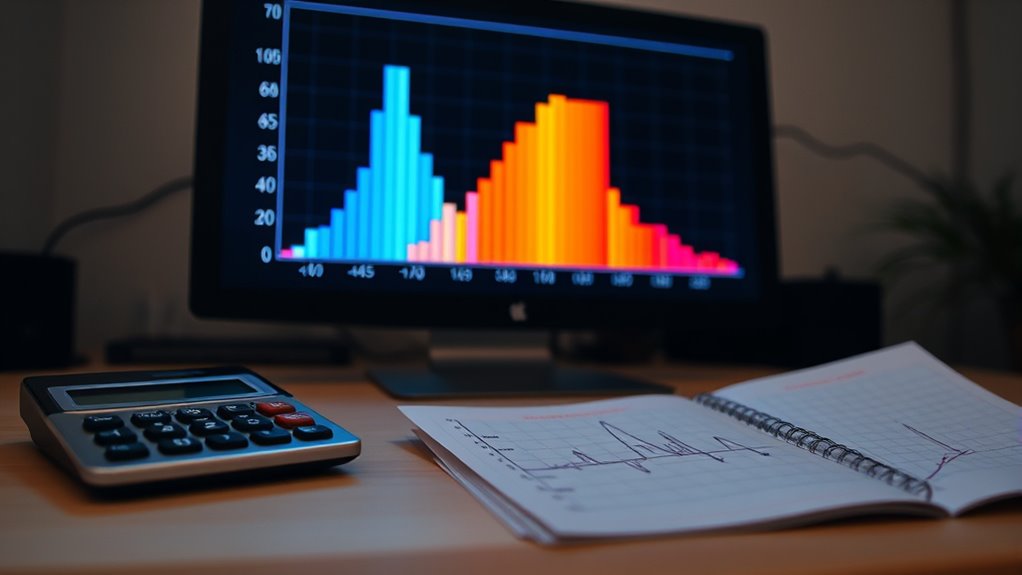
Stretching Image Intensity Levels
Stretching image intensity levels involves adjusting the brightness and contrast of an image to make details more visible. This technique enhances the overall appearance by redistributing pixel values, improving contrast enhancement, and increasing color saturation where needed. As a result, your image becomes more vibrant and easier to interpret. Picture these effects:
- Bright areas become more pronounced and detailed
- Shadows gain depth without losing definition
- Colors appear more vivid and true to life
- Fine textures stand out clearly
- Overall contrast becomes balanced, avoiding dullness
- This process is essential in fields like digital imaging and enhances visual clarity across various applications.
Normalizing Data for Consistent Results
To achieve consistent results across different images, normalizing data is a key step that standardizes pixel values, making comparisons more reliable. By adjusting pixel intensity ranges, you improve contrast enhancement and ensure the dynamic range is consistent. This process helps prevent variations caused by differing lighting conditions or camera settings. Use normalization to scale pixel values between 0 and 1 or 0 and 255, depending on your needs. Here’s a quick overview:
| Step | Action | Purpose |
|---|---|---|
| 1 | Calculate min and max pixel values | Identify range |
| 2 | Subtract min from each pixel | Shift to start at zero |
| 3 | Divide by range | Normalize to 0-1 |
| 4 | Scale to desired range | Match target dynamic range |
| 5 | Apply contrast enhancement | Improve visual clarity |
Frequently Asked Questions
How Does Histogram Equalization Affect Image Contrast?
Histogram equalization boosts your image contrast by spreading out pixel intensity values evenly across the histogram. This process enhances color and detail, making features more distinguishable. However, it can also amplify noise, reducing image quality if not managed carefully. Overall, it’s a powerful technique for color enhancement, but you should balance it with noise reduction to maintain clarity and avoid unwanted artifacts.
Can Stretching Improve Images With Uneven Lighting?
Yes, stretching can improve images with uneven lighting by enhancing contrast and detail in darker or brighter areas. You might think it could cause more noise, but proper lighting correction and exposure adjustment guarantee a natural look. By applying stretching techniques, you effectively balance the exposure across the image, making details pop without overexposing or underexposing sections. This process results in a clearer, more visually appealing image.
What Are Common Errors in Histogram Calculations?
You might make common errors in histogram calculations if you overlook proper brightness adjustment or neglect histogram smoothing. For example, misaligning the histogram can cause incorrect contrast enhancement, leading to washed-out or overly dark images. Failing to smooth the histogram can result in jagged adjustments that introduce noise. Always guarantee accurate brightness adjustment and apply histogram smoothing to achieve balanced, natural-looking images without calculating errors.
How to Choose the Number of Bins for a Histogram?
Choosing the right number of bins is like tuning a fine instrument—you want clarity without chaos. Start by examining your data distribution; if it’s spread out, use more bins for detail. For smaller datasets, fewer bins reduce noise. A common rule is Sturges’ formula, which balances detail and simplicity. Adjust as needed based on how well the bins reveal patterns, ensuring your histogram communicates your data story clearly.
Is Histogram Stretching Suitable for All Image Types?
Histogram stretching isn’t suitable for all image types, especially those with complex color spaces or subtle details. It works best for images with poor contrast but can introduce histogram artifacts or color distortions in highly detailed or color-sensitive images. You need to contemplate the image’s color space and the risk of artifacts before applying histogram stretching, ensuring it enhances rather than degrades your image quality.
Conclusion
Now that you’ve uncovered the secrets behind histograms and stretching, you hold the power to transform dull images into vivid visuals. Think of these calculations as your secret toolkit—unlocking clarity and detail with every step. Don’t let your images remain hidden in the shadows; instead, illuminate them with confidence. Master these techniques, and watch your photos come alive—because in the world of image processing, knowledge truly is the brightest light.